Global Health Informatics and Visualization
What is Global Health Informatics?
- Health Informatics: An interdisciplinary field combining health sciences, information technology, and data analytics to improve health equity worldwide (“National Information Center on Health Services Research; Health Care Technology (NICHSR) - Hsric.nlm.nih.gov”).
- Global Health: The development, adoption, and application of an area for study, research, and practice that places a priority on improving health and achieving equity in health for all people worldwide (Koplan et al. 2009).
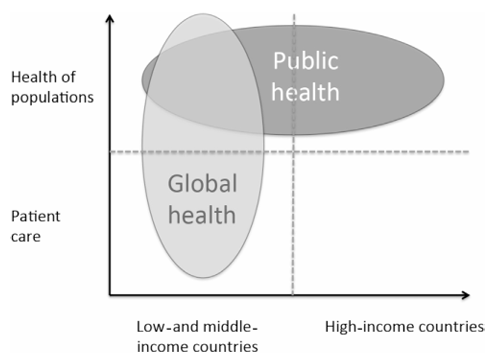
Enhancing access and equity in healthcare delivery


- Non-Prep HIV prevention in Kenya (Mwaisaka et al. 2021): Improving on
- Enhanced knowledge
- Self-efficacy
- Behavioral intention
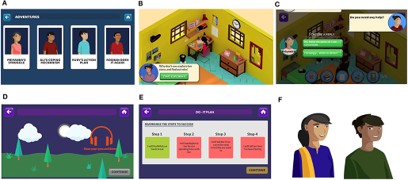
- Youth mental health in India (Gonsalves et al. 2019):
- Gamification
Disease surveillance
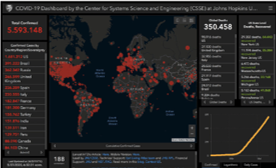
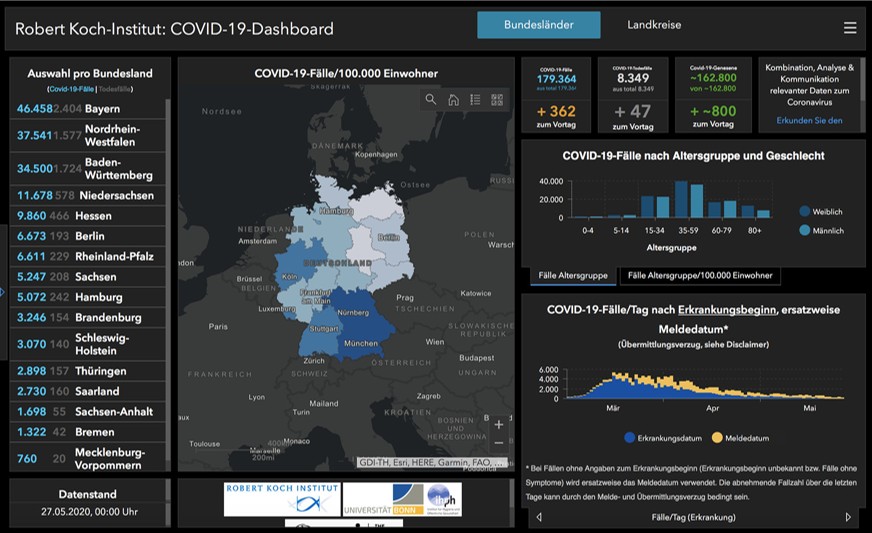
- Dashboard for COVID-19 (Everts 2020):
- Intervention
- Surveillance
- Arguments:
- Nationalism
- Neglecting social determinants of health
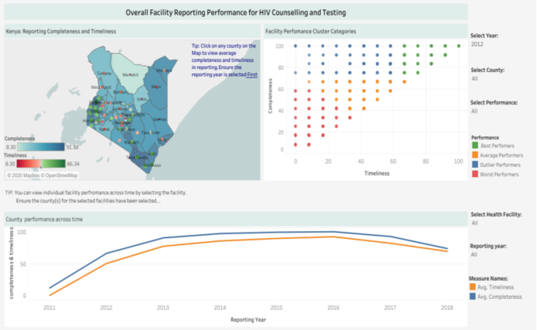
- Dashboard for HIV in Kenya (Gesicho and Babic 2022):
- Leveraging DHIS2 system (WHO system) for integrating reporting and surveillance
Decision support and policy


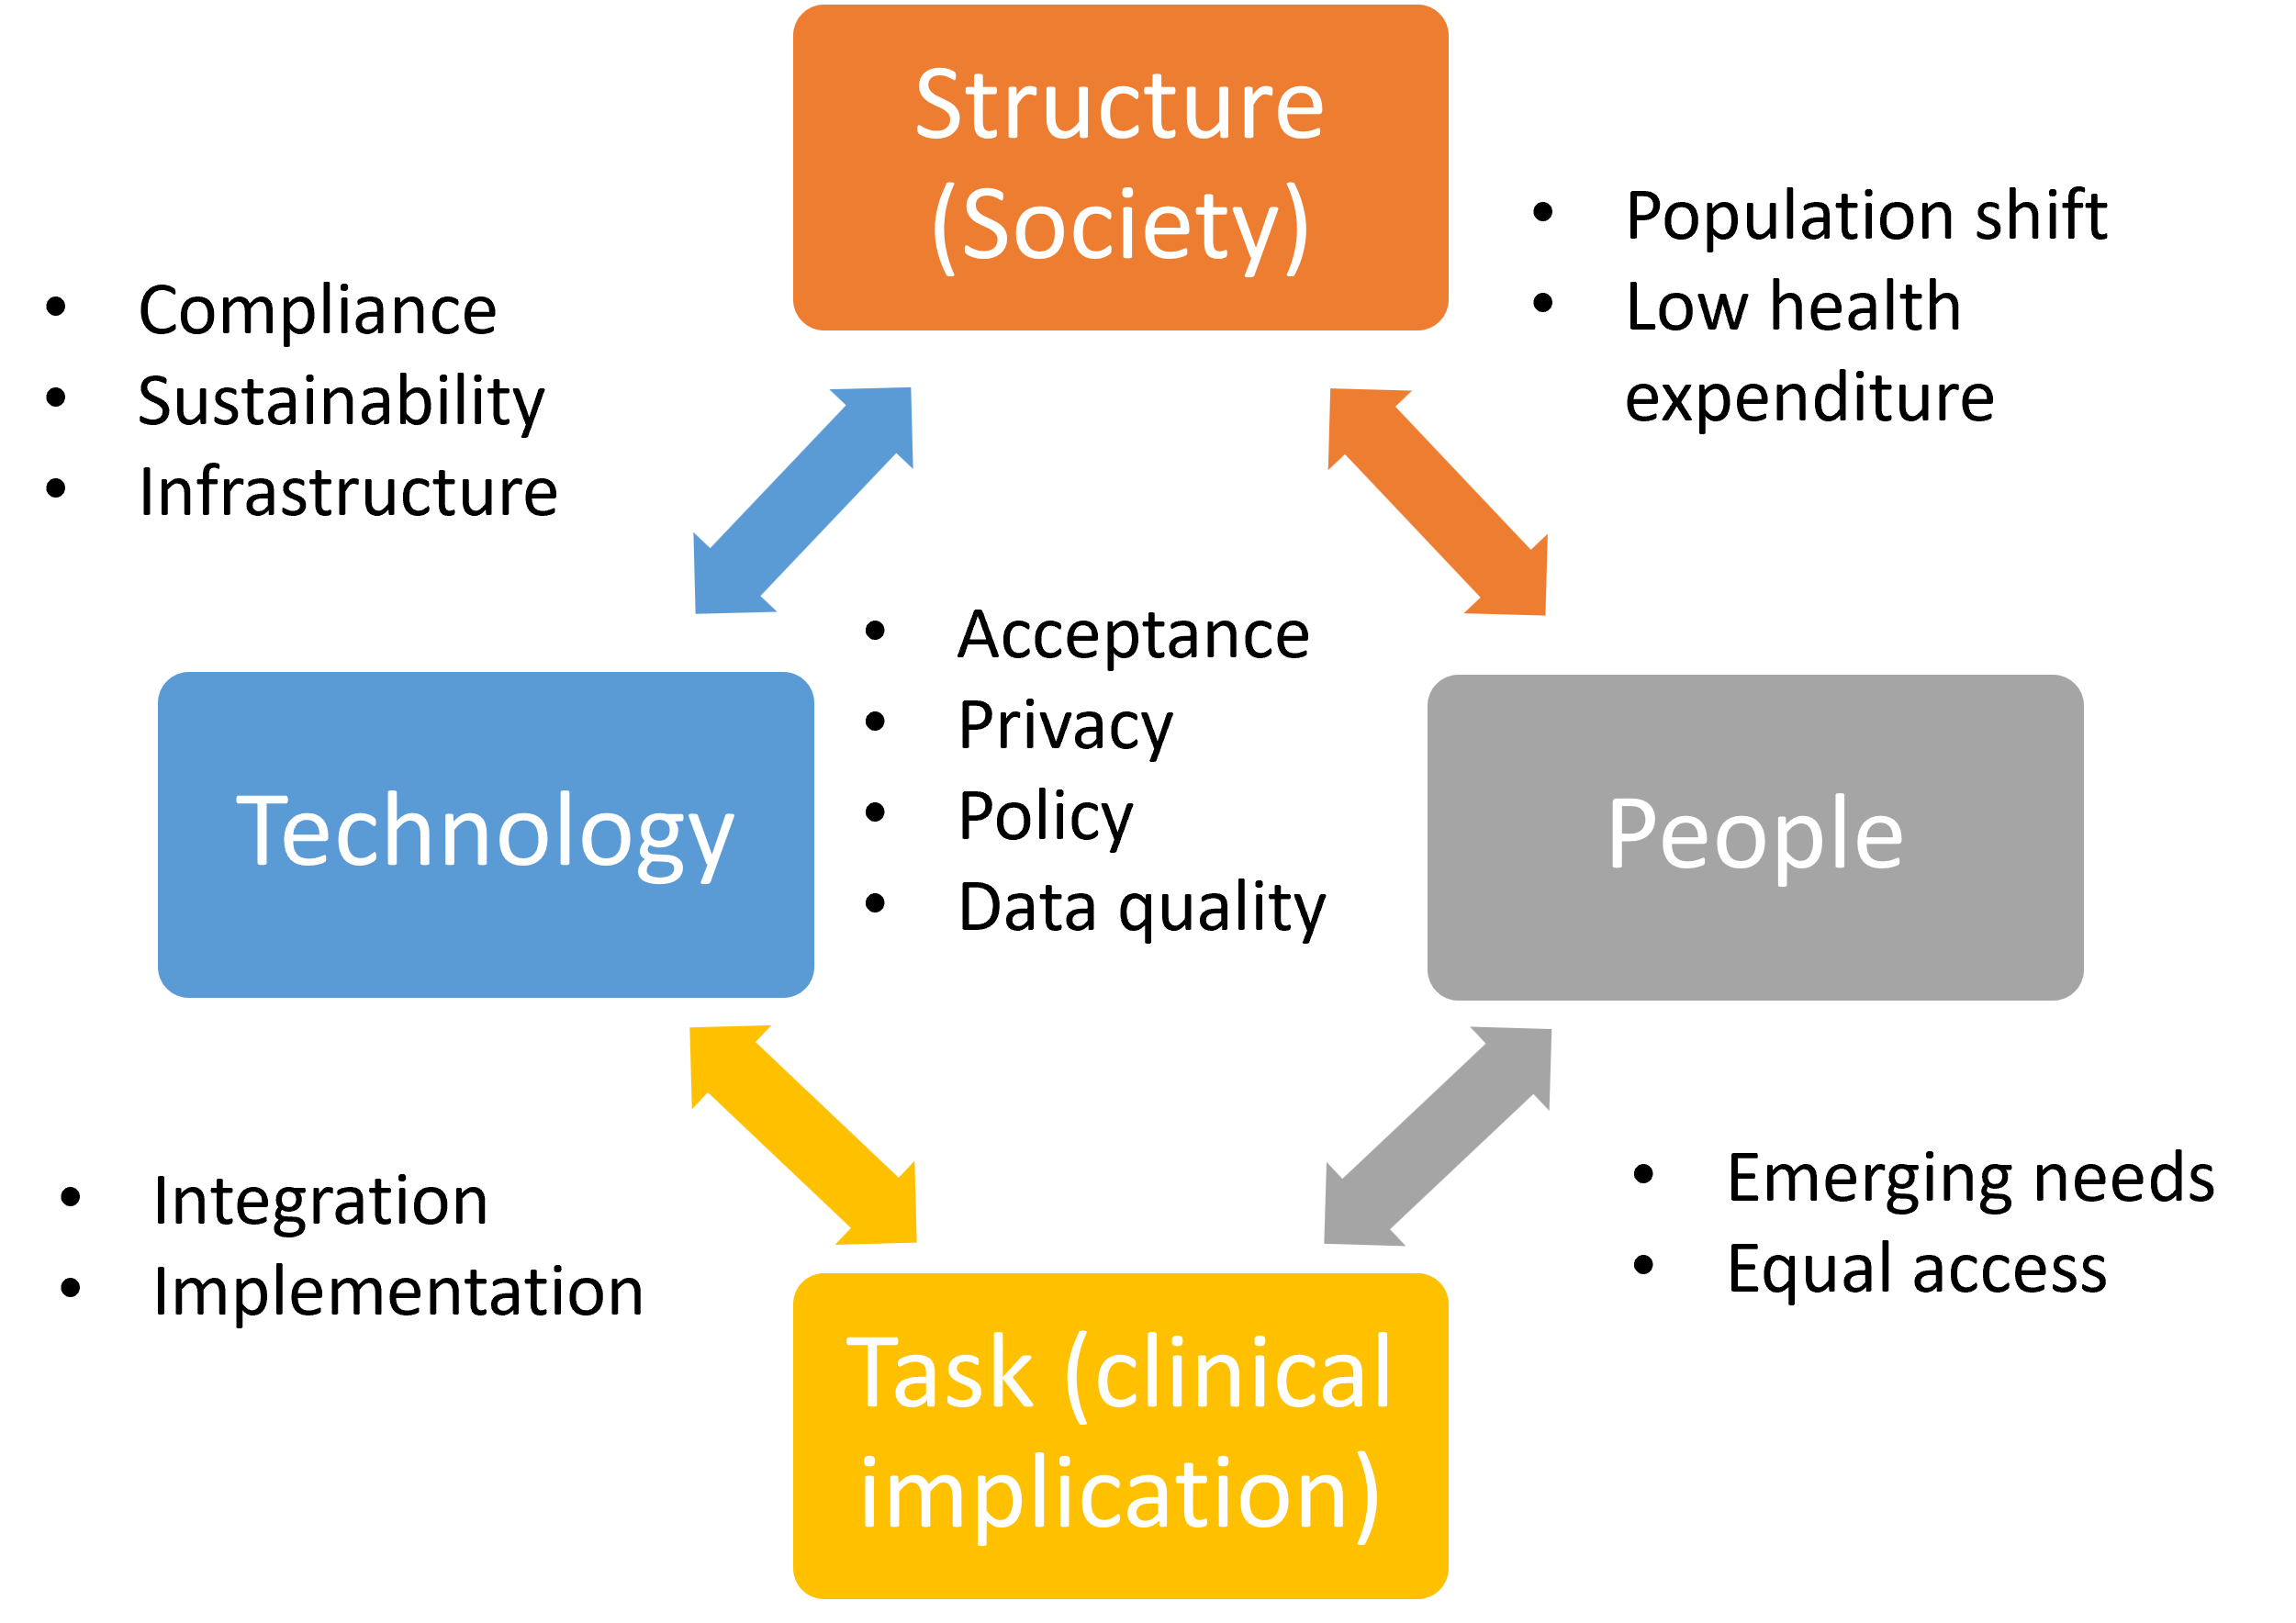
Challenges in global health informatics
- Leavitt’s diamond framework (Wigand 2007)
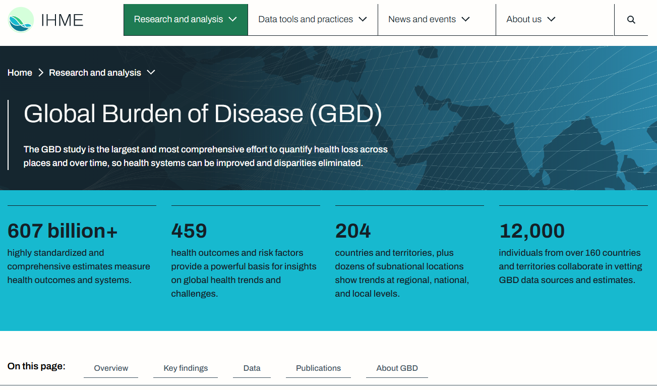
Global Burden of Disease (GBD)
- GBD dataset focuses on health loss across:
- Diseases
- Places
- Time
- Additional items:
- Demographic
- Fertility
- Life expectancy
- Socio-Demographic Index
- DALY/HLY
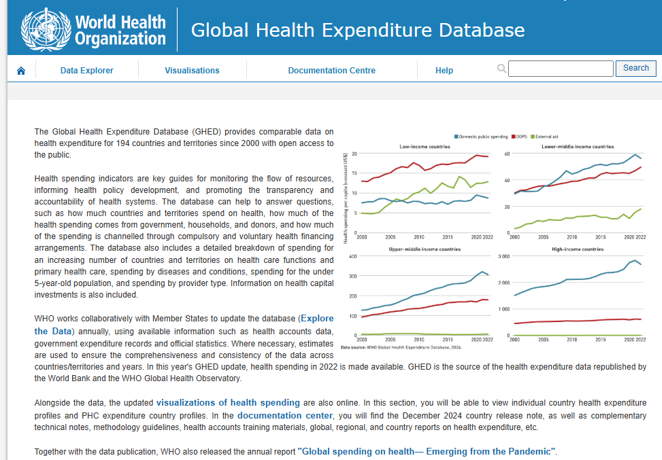
Global Health Expenditure Database (GHED)
- Tracking and analyzing health spending trends
- Assessing health expenditure by different levels:
- Sources (e.g., government, households, donors)
- Financing mechanisms (compulsory vs. voluntary)
- Country-wise comparison
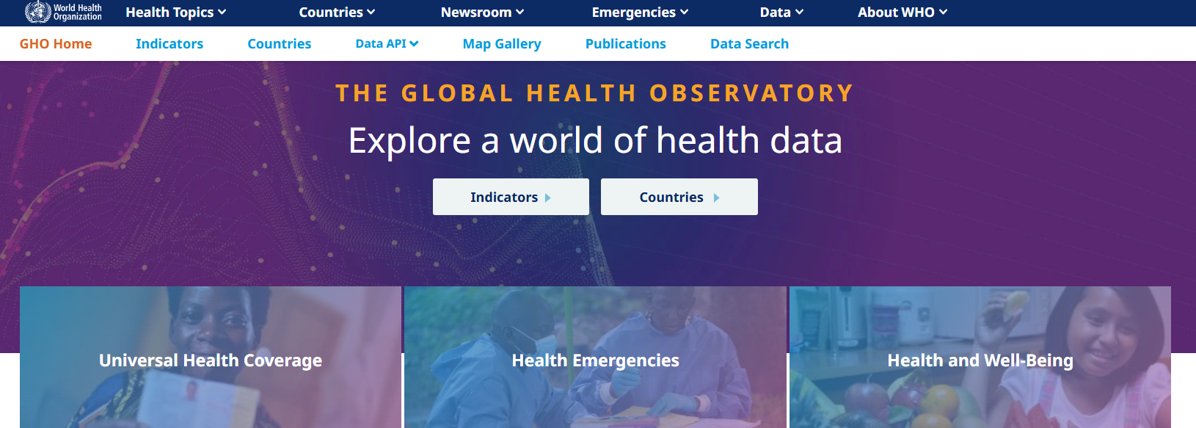
Global Health Observatory (GHO)
Global Health Observatory is the data hub from WHO aggregating all the data under the WHO umbrella
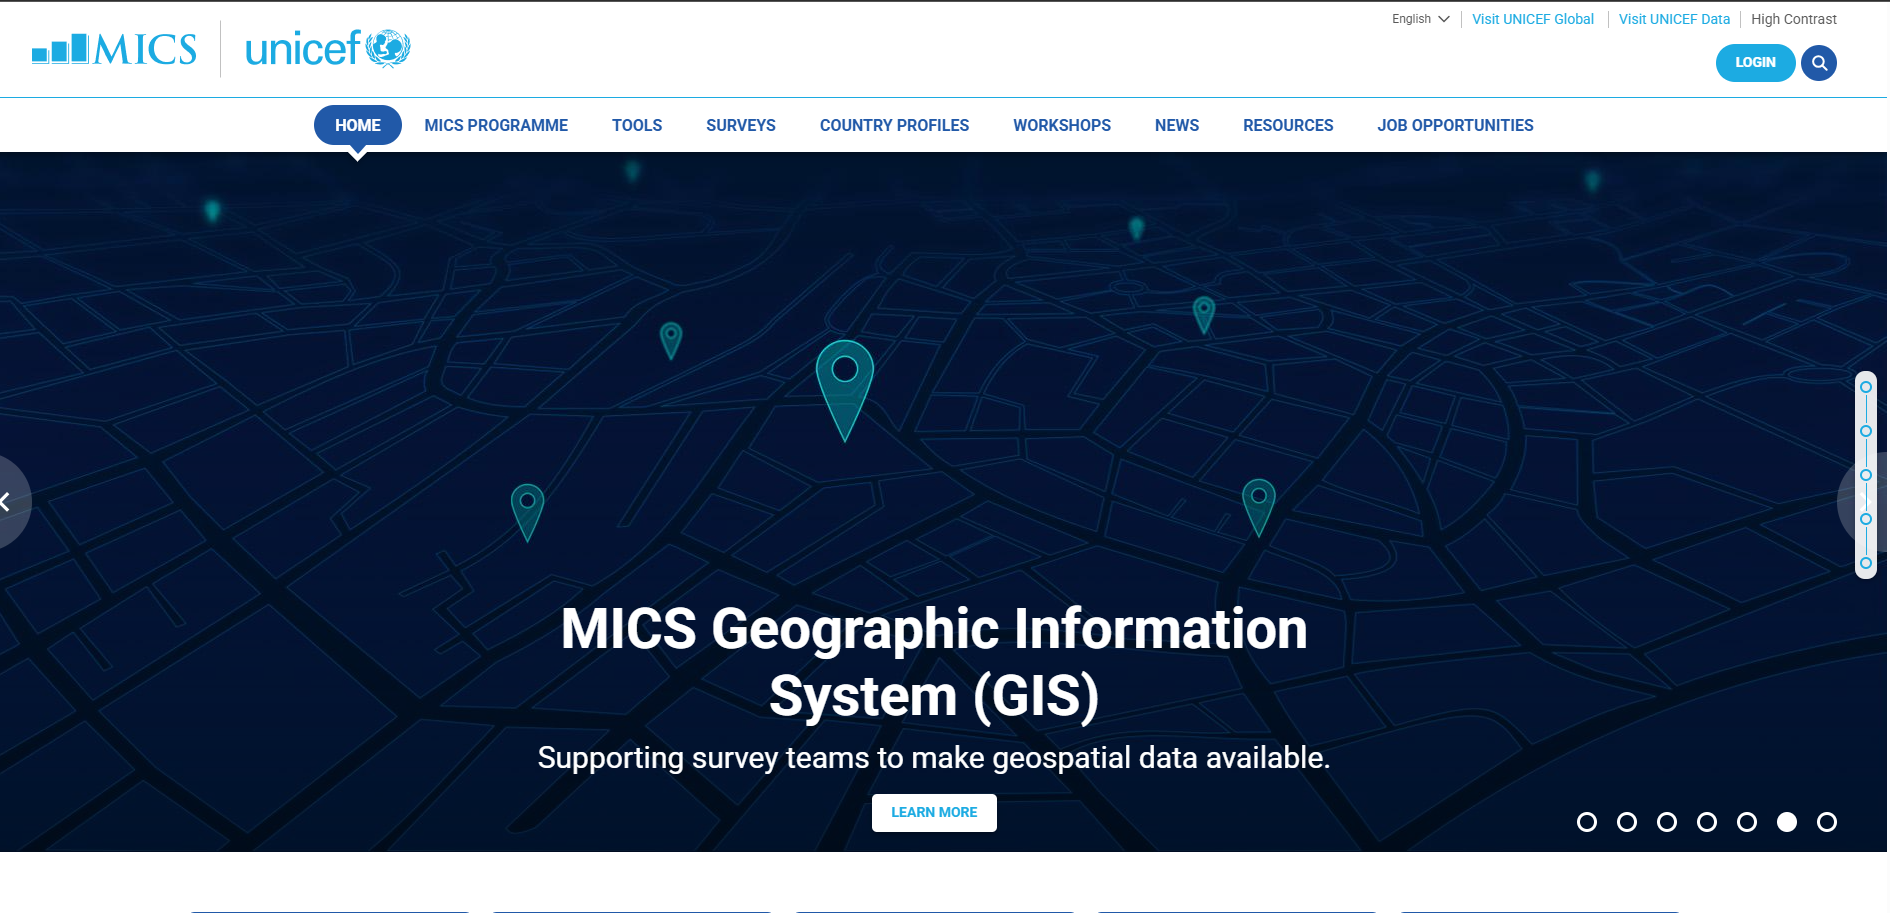
Multiple Income Cluster Survey (MICS)
MICS is a survey under UNICEF focusing on women and children in LMIC:
- Child health
- Child development
- Literacy
- Protection
- HIV
- Well-being
Principle of visualizing data
- Effective: Information conveyed by one visualization is more readily perceived
- Expressiveness: The visualizations express all the facts in the set of data, and only the facts in the data
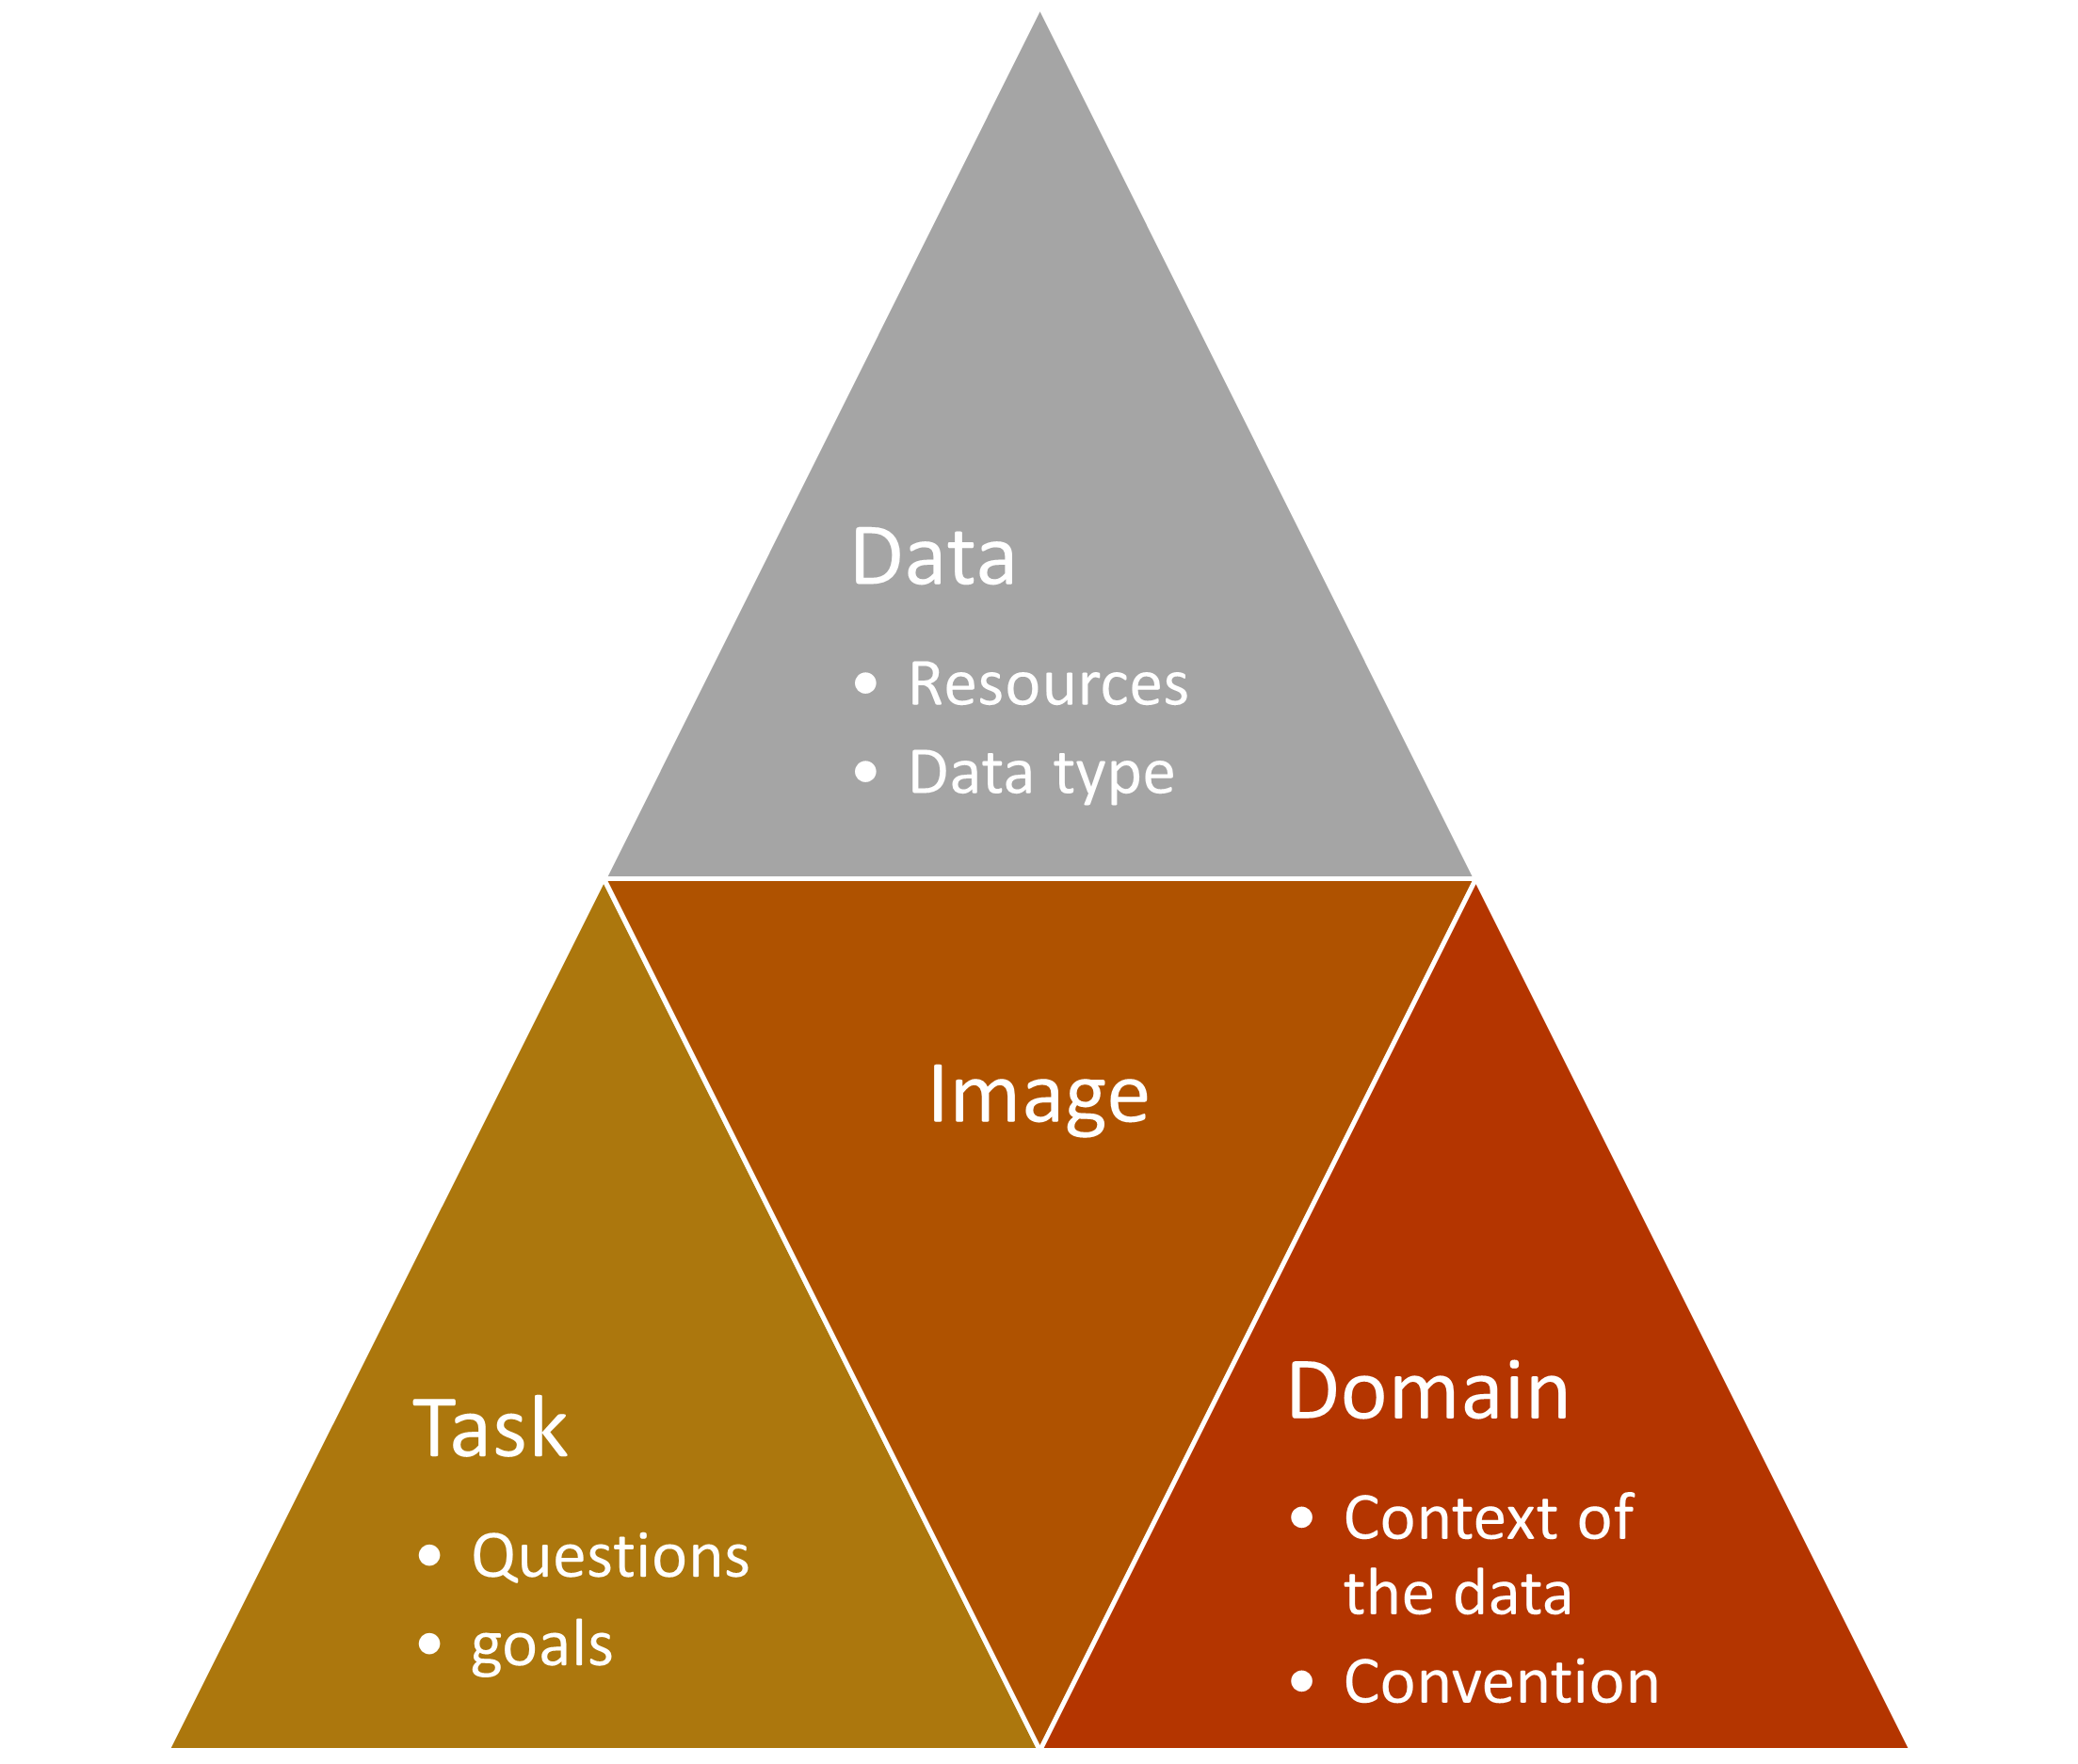
Principle of visualizing data
Motivations
- When more than two variables need to be presented (hopefully in one graph):
- What is the best way to present them?
- What are the pre-attentive features (easily perceived by humans)?
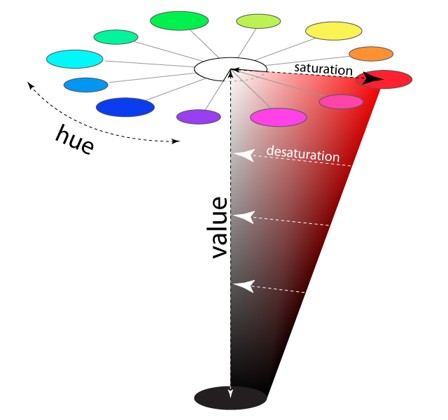
Pre-attentive features
- Location
- Colour:
- Hue
- Saturation
- Shape:
- Length
- Shape
- Texture
- Area
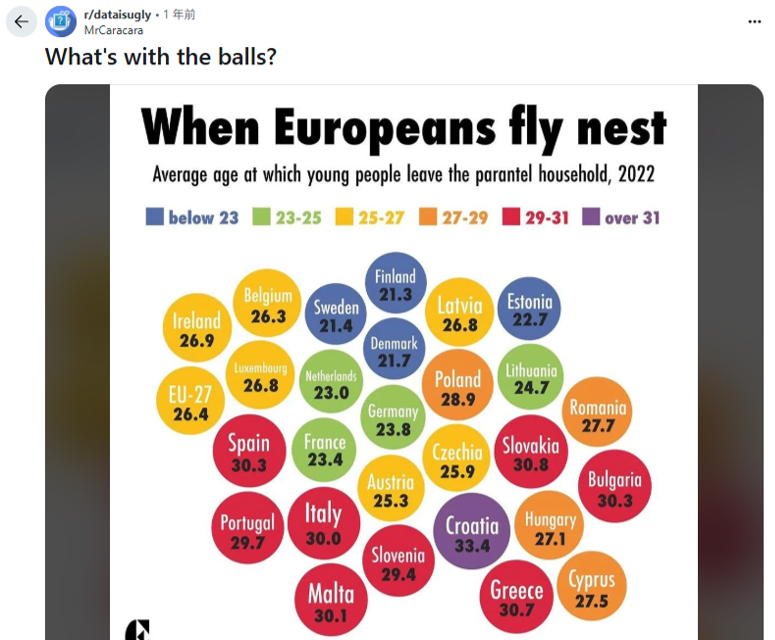
Combinations of pre-attentive features are not pre-attentive, e.g., Red triangle vs. Green rectangle
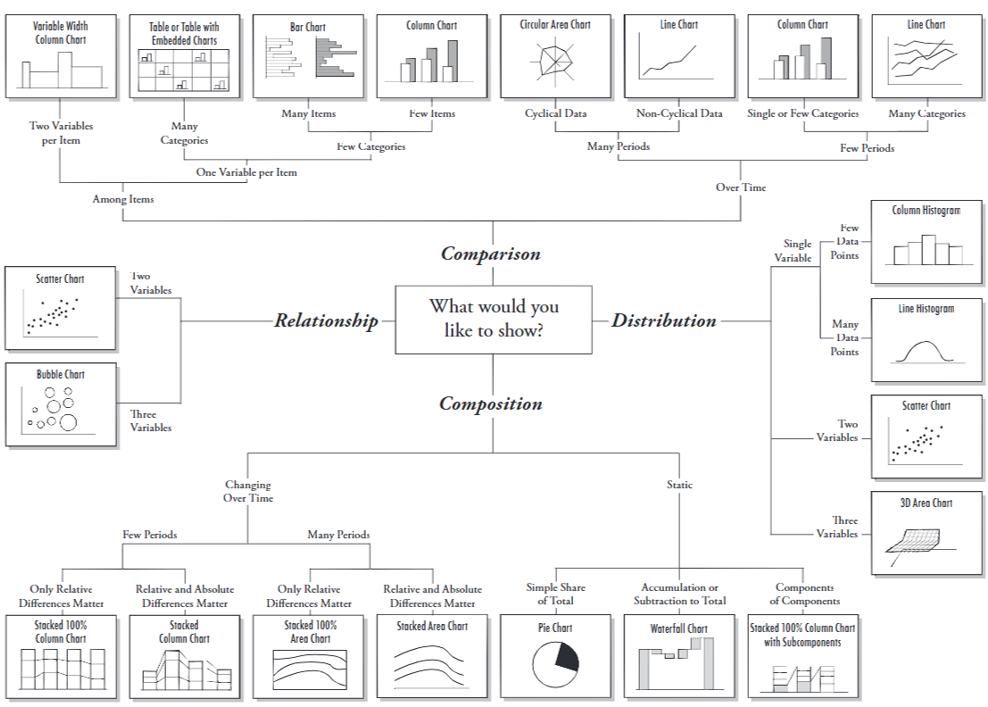
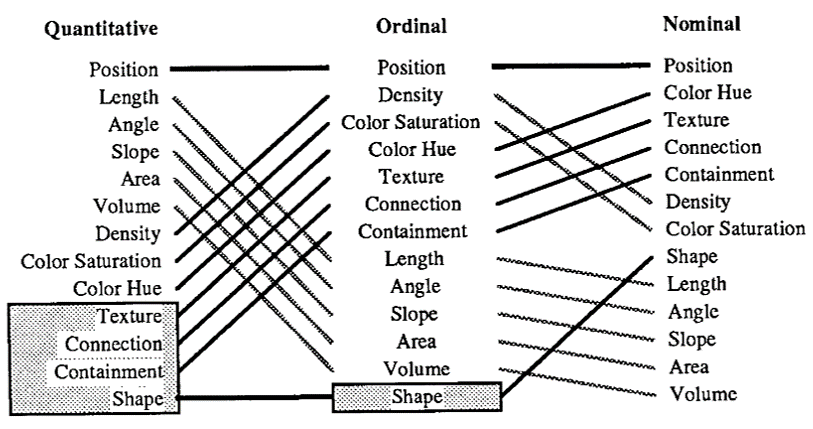
Mackinlay’s Ranking
- Mackinlay developed the ranking to choose the best way to present data
- Rule of thumb: Don’t go to ranking below 5

Social and cultural context consideration
Cultural context: